Wei Cheng 於 2006 年的 SUGI 31 發表了一篇關於 ODS (Output Delivery System)繪製高解析度圖形的報告,相當具有建設性!!SAS 在以前最被人詬病的就是複雜的做圖程式還有與所花時間不成比例的低劣品質。這一直到現在還是一些人拒絕使用 SAS 的理由,尤其當不需要使用複雜資料整理和模式配適,而只要簡單生一個 box plot 或 histogram 的時候,讓許多人轉而用 SPSS 或其他統套軟體。現在經由 ODS 就可以在彈指之間,一口氣地畫出很複雜的圖形。現在,就來介紹 ODS/GRAPHICS 最基本的語法:
ODS GRAPHICS ON [/ MAGEFMT = image-file-type | STATIC | STATICMAP
IMAGENAME = filename RESET ];
procedures or data steps
ODS GRAPHICS OFF;
一開始,需用 ODS GRAPHICS ON 來啟動 ODS/GRAPHICS,後面可以加上一些圖檔格式和名稱的設定,但完全不加也沒有關係。中間就可以放任何的 Data procedure 和 Proc procedure,最後再用 ODS GRAPHICS OFF 來關閉 ODS。
以下就來介紹一些例子。
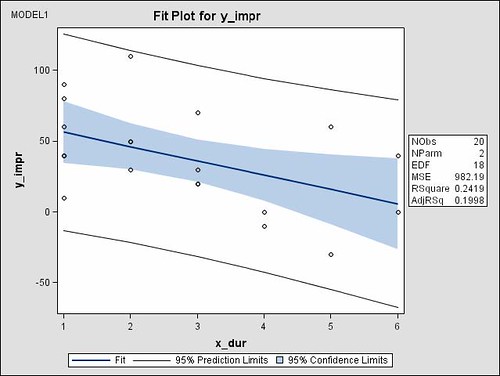
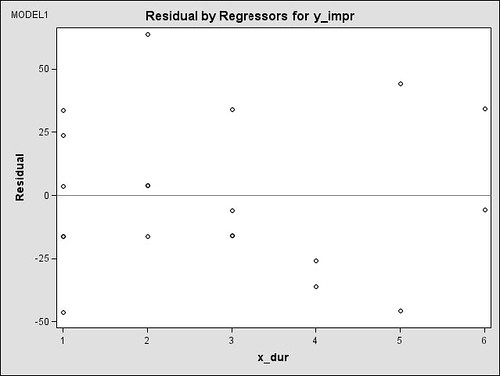
@ Regression @
ods html;
ods graphics on / imagename = 'regression';
proc reg data = angina;
model y_impr = x_dur;
run;quit;
ods graphics off;
ods html close;
上述只是一個很簡單的迴歸程式,但只要在 PROC REG 前後粗體黑字部分的指令,就可以一口氣生出下列圖形:

如果想要將這些圖分別儲存的話,只要在 PROC REG 後面加上 plots(unpack) 即可。
ods html;
ods graphics on;
proc reg data = angina plots(unpack);
model y_impr = x_dur;
run; quit;
ods graphics off;
ods html close;
附帶一提的是,所有的輸出報表和圖形,因為 ODS HTML 被呼叫的關係,都會被儲存為 html 檔。
另外,可以用 ods select 的指令來指定只生成某一圖檔。以上述圖形而言,想只生成最左邊那張圖,可用 ods select fit 來限定:
ods html;
ods graphics on;
ods select fit;
proc reg data = angina;
model y_impr = x_dur;
run;
quit;
ods graphics off;
ods html close;
如果描繪的點太多,沒有辦法把每一點的 ID 都標示在圖片上,這時可以用 imagefmt = staticmap 的指令,讓觀測值相關訊息可透過滑鼠來顯示。程式如下:
ods html;
ods graphics on / imagefmt = staticmap;
ods select fit;
proc reg data = angina;
model y_impr = x_dur;
run;
quit;
ods graphics off;
ods html close;
從下圖可知,當滑鼠移到某一點時,就會彈出新的訊息框顯示相關訊息。

總而言之,在 PROC REG 下可以用 ODS/GRAPHICS 產生八種圖形:
• Residuals versus the predicted values
• Studentized residuals versus the predicted values
• Studentized residuals versus the leverage
• Normal quantile plot of the residuals
• Dependent variable values versus the predicted values
• Cook's D versus observation number
• Histogram of the residuals
• A "Residual-Fit" (or RF) plot consisting of side-by-side quantile plots of the centered fit and the residuals.
@ GLM @
GLM 的分析中並沒有用到太多的圖形,但利用 ODS/GRAPHICS 仍可在 PROC GLM 中生出簡單的 box plot。同樣也是只要呼叫 ods graphics 即可。
ods html;
ods graphics on;
proc glm data = angina;
class x_dur;
model y_impr = x_dur;
run; quit;
ods graphics off;
ods html close;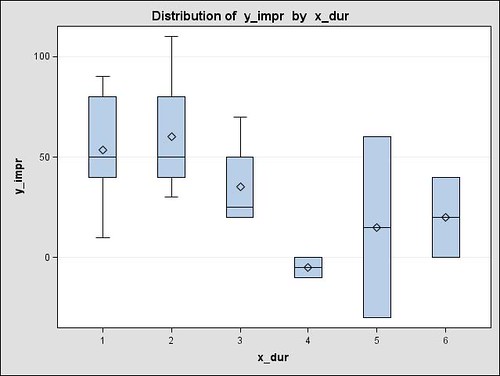
@ANCOVA @
共變數分析同樣利用 PROC GLM 完成,不同的地方在於模式裡面有個連續變數。因此當 SAS 發現有連續變數放入 PROC GLM 時,就會啟動共變數分析。此時若同時啟動 ODS/GRAPHICS 系統,則會產生 covariance plot。程式和圖形如下:
ods html;
ods graphics on / imagename = 'ancova';
proc glm data = tri;
class trt;
model trichg = trt hgba1c / solution;
run; quit;
ods graphics off;
ods html close;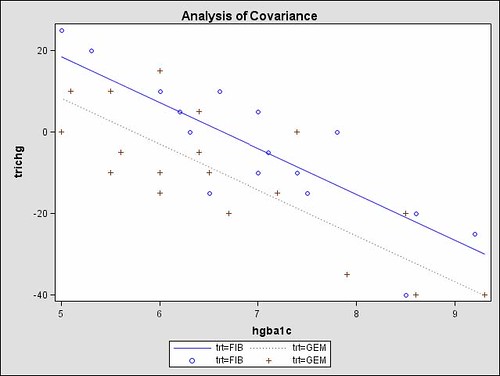
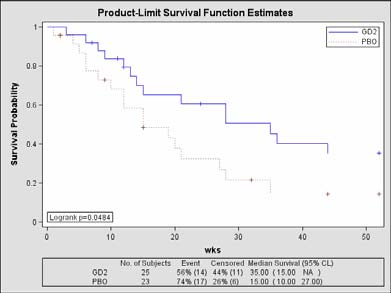
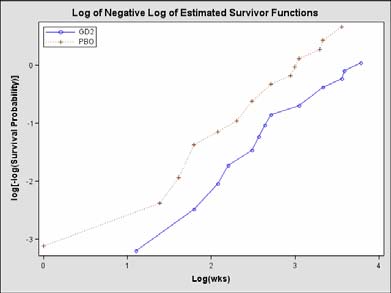
@ Log Rank Test @
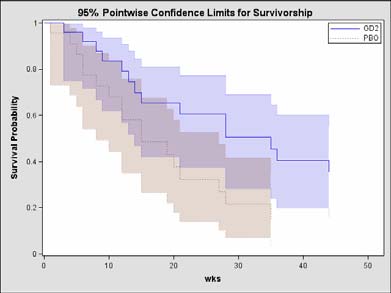
在倖存分析中,可用 PROC LIFETEST 來進行 Log Rank 檢定。同樣地,也可利用 ODS/GRAPHICS 將最後的倖存機率畫出來。
ods html;
ods graphics on / imagename = 'lifetest';
proc lifetest data = hsv;
time wks * cens (1);
strata vac;
run;
ods graphics off;
ods html close;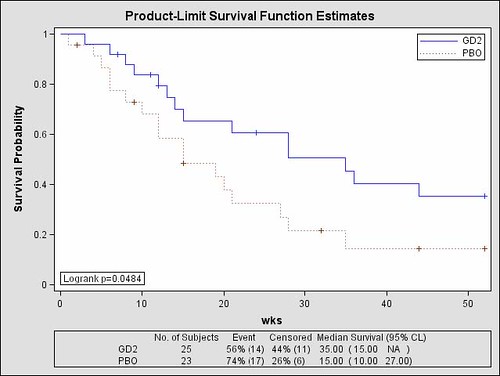
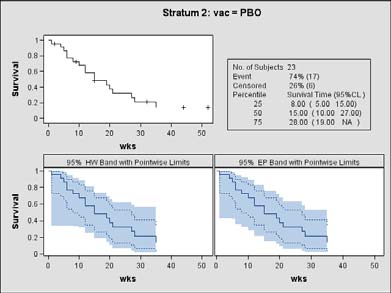
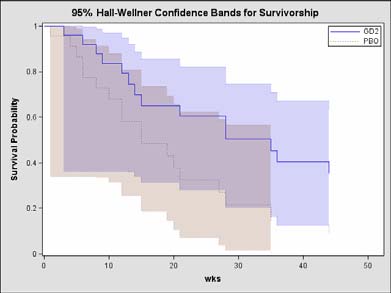
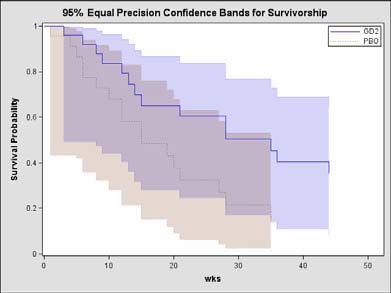
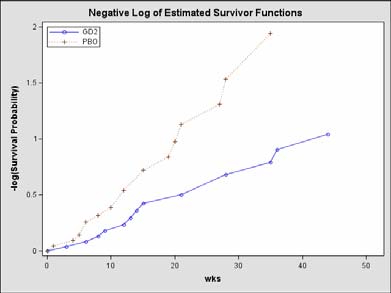
如果想看各細部的圖形,可利用下面的程式來增生:
ods html;
ods graphics on;
proc lifetest data = hsv;
time wks * cens (1);
strata vac;
survival plots = (survival,density,epb,hazard,loglogs,logsurv,hwb,cl,stratum);
run;
ods graphics off;
ods html close;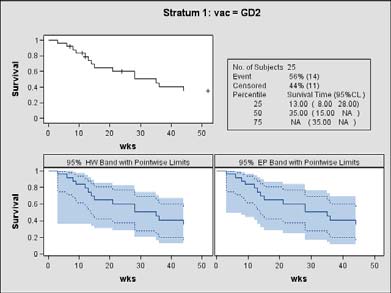
以上所有的 ODS/GRAPHICS 範例,都是用預設的設定來繪圖,而這些設定都放在一個叫做 Stat.Reg.Graphics 的模版裡面。當然,這個模版也是可以做調整的,只要利用 PROC TEMPLATE 的程序,就可以做進一步的更動。PROC TEMPLATE 的基本語法如下:
PROC TEMPLATE;
DEFINE STATGRAPH name-of-graph-definition;
[declaration-statements;]
[layout-statements;]
[plot-statements;]
[text-statements;]
END;
RUN;
要嵌入自訂的模版,可在 Data procedure 中加上下面黑色粗體字的那兩行。
ODS GRAPHICS ON;
DATA _NULL_;
SET my-data;
FILE PRINT
ODS = (TEMPLATE = “my-graphics-template”);
PUT _ODS_;
RUN;
文內並沒有詳細說明 PROC TEMPLATE 的所有語法,僅列了兩個例子,因此我只寫其中一個範例在這,詳細情況請參見原文。
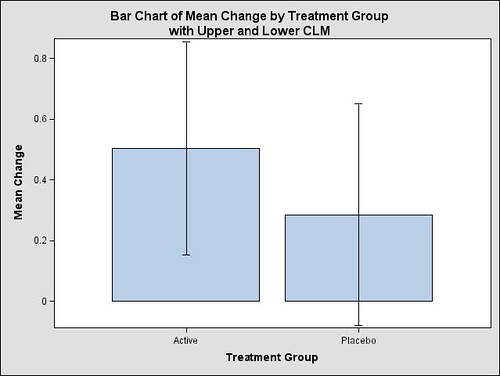
@ TWO-SAMPLE T-TEST @
程式:
proc format;
value $trt 'A' = 'Active' 'P' = 'Placebo';
run;
data fev;
length trtgrp $ 7;
input patno trt $ fev0 fev6 @@;
chg = fev6 - fev0; if chg = . then delete; trtgrp = put(trt, $trt.);
datalines;
101 A 1.35 . 103 A 3.22 3.55 106 A 2.78 3.15
……
;
run;
proc template;
define statgraph mygraphs.meanchg;
layout gridded;
entrytitle 'Bar Chart of Mean Change by Treatment Group' ;
entrytitle 'with Upper and Lower CLM' ;
barchartparm x = trtgrp y = chg_mean / yerrorupper=uclm yerrorlower=lclm;
endlayout;
end;
run;
ods html;
ods graphics on / imagename='meanchange';
proc summary data = fev nway;
class trtgrp;
var chg;
output out = meanchg (drop = _type_ _freq_) mean = chg_mean lclm = lclm uclm = uclm;
run;
data _null_;
set meanchg;
label chg_mean = "Mean Change" trtgrp = "Treatment Group";
uclm = uclm - chg_mean; lclm = chg_mean - lclm;
file print ods = (template='mygraphs.meanchg');
put _ods_;
run;
ods graphics off;
ods html close;
圖形:
CONTACT INFORMATION
I welcome and appreciate your comments and questions. Contact the author at:
Wei Cheng,
Isis Pharmaceuticals, Inc.,
1896 Rutherford Rd., Carlsbad, CA 92008
(760) 603-3807
Email: wcheng@isisph.com
沒有留言:
張貼留言
要問問題的人請在文章下方的intensedebate欄位留言,請勿使用blogger預設的意見表單。今後用blogger意見表單留言的人我就不回應了。