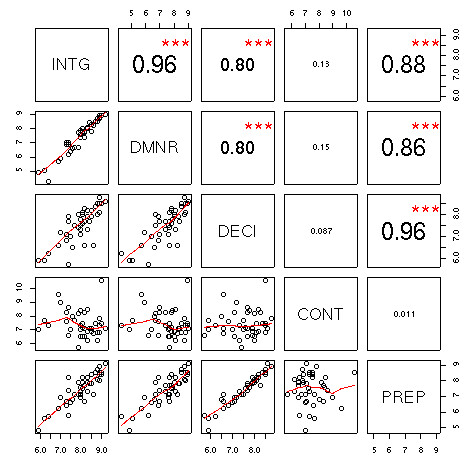
R 可以很鬼神般地畫出這種樣式的 scatterplot matrix。
不過 SAS 的 PROC CORR 沒有那麼強大的功能。Robert A. Vierkant 提供了一個 macro 程式讓使用者也可以用 SAS 做出類似的圖出來。
原始程式如下:
***************************************;
** SAS MACRO PLOTMAT                 **;
** PARAMETERS ARE AS FOLLOWS         **;
**                                   **;
** 1) ds=data set                    **;
** 2) numvars=number of variables to **;
** be in matrix (2 to 10)            **;
** 3) var1--var10=names of variables **;
** in the matrix. If have less       **;
** than 10, then leave values        **;
** of remaining variables null       **;
** 4) title=title of scatterplot     **;
** matrix. Default is null           **;
** 5) corr=option to print correla-  **;
** tions with scatterplots.          **;
** Options are YES or Y, and         **;
** NO or N                           **;
**                                   **;
***************************************;
%macro plotmat(ds=,
              numvars=,
              var1=,
              var2=,
              var3=,
              var4=,
              var5=,
              var6=,
              var7=,
              var8=,
              var9=,
              var10=,
              title=,
              corr=N
             );
****generate means and correlations;
proc corr data=&ds out=tmp noprint;
   var &var1 &var2 &var3 &var4 &var5 &var6 &var7 &var8 &var9 &var10;
run;

data tmp;
   set tmp;

****create macro variables for all means;
   if _TYPE_='MEAN' then do;
     %do i=1 %to &numvars;
       call symput("m&i",trim(left(put(&&var&i,10.2))));
     %end;
   end;

****create macro variables for all correlations;
   %do i=1 %to &numvars;
       if _NAME_=upcase("&&var&i") then do;
           %do j=1 %to &numvars;
               %let k=%eval((&i-1)*&numvars+&j);
           call symput("c&k",trim(left(put(&&var&j,10.2))));
           %end;
       end;
   %end;
run;

****create annotate data sets used to place correlation on scatterplot;
   %if %upcase(&corr)=Y or %upcase(&corr)=YES %then %do;
       %do i=1 %to &numvars;
           %do j=1 %to &numvars;
               %let k=%eval((&i-1)*&numvars+&j);
               data annot&k; function='label';
               xsys='3'; ysys='3'; y=96; x=50;
               hsys='3'; size=8; style='centx';
               text="correlation: &&c&k"; output;
               run;
           %end;
       %end;
   %end;

****graphic options;
goptions reset=global device=win nodisplay gunit=pct border rotate=landscape;

****scatterplots for the off-diagonal;
symbol1 h=2 value=dot;
axis1 label=none minor=none
value=(h=3 f=simplex);
proc gplot data=&ds gout=plotmat;

****title if correlation=yes is specified;
title;
%if %upcase(&corr)=Y or %upcase(&corr)=YES %then %do;
   title h=8 f=centx ' ';
%end;
%do i=1 %to &numvars;
%do j=1 %to &numvars;
%let k=%eval((&i-1)*&numvars+&j);
plot &&var&i*&&var&j / vaxis=axis1 haxis=axis1 name="g&i._&j"
              %if %upcase(&corr)=Y or %upcase(&corr)=YES %then %do;
               anno=annot&k
              %end;
;
%end;
%end;
run; quit;

****variable names and means for diagonal elements;
%do l=1 %to &numvars;
proc gslide gout=plotmat name="m&l";
   title1 h=10 f=centx lspace=30 "&&var&l";
   title2 h=10 f=centx lspace=8 "Mean=&&m&l";
run; quit;
%end;
****graph for the title;
proc gslide gout=plotmat name='title';
title h=4 f=centx &title;
run; quit;

****create template;
goptions display;
proc greplay igout=plotmat tc=tempcat nofs;
****assign the x and y coordinates within the template for each graph that is to be represented;
tdef m&numvars
%let num=%eval(&numvars-1);
%if &title= %then %let totpct=100;
%else %let totpct=95;

%do i=0 %to #
 %do j=1 %to &numvars;
  %let t=%eval(&i*&numvars+&j);
  %let lx=%eval(100*(&j-1)/&numvars);
  %let ly=%eval(&totpct*(&numvars-&i-1)/&numvars);
  %let uy=%eval(&totpct*(&numvars-&i)/&numvars);
  %let rx=%eval(100*&j/&numvars);
  %let x=&t. / llx=&lx. lly=&ly. ulx=&lx. uly=&uy. urx=&rx. ury=&uy. lrx=&rx. lry=&ly;
  &x
 %end;
%end;

%if title^= %then %do;
 %let t=%eval(&t+1);
 %let x=&t. / llx=0 lly=0 ulx=0 uly=100 urx=100 ury=100 lrx=100 lry=0;
 &x
%end;
;
template m&numvars;
****place graphs in the boxes created for template defined above;
treplay
%do i=1 %to &numvars;
 %do j=1 %to &numvars;
  %let t=%eval((&i-1)*&numvars+&j;
  &t:
  %if &i=&j %then %do;
  m&i
 %end;
 %else %do;
g&i._&j
%end;
%end;
%end;
%if title^= %then %do;
%let t=%eval(&t+1);
&t:title
%end;
;
run; quit;

****delete graphs from temporary catalogs;
proc catalog c=plotmat kill; run; quit;
%mend plotmat;
變數解釋:
- ds:資料檔名稱
- numvars:變數數量
- var1~var10:變數名稱。最多就是只能放十個。小於十個的話,多的 varn 就不用寫出來了。
- title:散佈圖矩陣的標題
- corr:要不要印出相關係數。要的話填 YES 或 Y,不要的話填 NO 或 N。
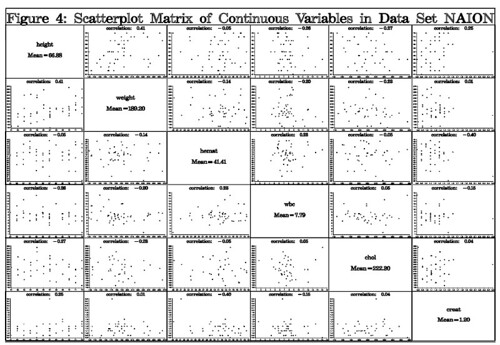
由於原文內沒有提供實際的資料,所以就直接來看使用方法:
%plotmat(ds=naion,
    numvars=6,
    var1=height,
    var2=weight,
    var3=hemat,
    var4=wbc,
    var5=chol,
    var6=creat,
    corr=Y,
    title=‘Figure 4: Scatterplot Matrix of Continuous Variables in Data Set NAION’
    );
這個程式使用了 naion 這個資料檔,總共要用六個變數去畫圖,這些變數名稱分別是 height、weight、hemat、wbc、chol、creat。相關係數要印在圖上,最後設定一個 title。
成果如下:
CONTACT INFORMATION
Robert A. Vierkant, MAS
Marshfield Medical Research Foundation
1000 North Oak Avenue, ML2
Marshfield, WI 54449
(715) 389-3536
Email: vierkanr@mfldclin.edu
沒有留言:
張貼留言
要問問題的人請在文章下方的intensedebate欄位留言,請勿使用blogger預設的意見表單。今後用blogger意見表單留言的人我就不回應了。