SAS Global Forum 2008 於日前結束,而這一屆所有的技術文件有都上傳到官網上。綜觀今年的發表成果,有許多著墨在還沒有發佈的 V9.2 的功能上,不過目前該版本只有開放給 SAS 內部員工,至於發佈給外界的時間還沒確定,所以那些解說 V9.2 新功能的文件對一般使用者來講完全沒有用處。不過其他針對舊版 SAS 所開發出來的程式仍有一些突破。這篇文章就先分享一篇由 Rita Tsang 所發表的「彈指之間畫好圖」的 macro 程式。
這一個 macro 程式可以在改變一些參數設定下,輕易地畫出下列幾種圖形:bar chart、scatter plot with regression line、scatter plot、line plot 以及 KM-plot。先來介紹這個 macro 的使用方式。
%gengph(inds=,
    xvara=,
    xlabel=,
    xrange=,
    xfmt=,
    yvara=,
    ylabel=,
    yrange=,
    yfmt=,
    byvara=,
    bylabel=,
    byfmt=,
    gproc=,
refl=); - INDS:指定資料集名稱。
- XVARA:指定要放在X軸的變數。
- XLABEL:設定X軸的label。
- XRANGE (Optional):設定X軸的範圍。
- XFMT (Optional):使用者定義的X軸格式。
- YVARA:指定要放在Y軸的變數。
- YLABEL:設定Y軸的label。
- YRANGE (Optional):設定Y軸的範圍。
- YFMT (Optional):使用者定義的Y軸格式。
- BYVARA (Optional):指定離散變數 (categorical variable)。
- BYLABEL:指定上述離散變數的Label。
- BYFMT (Optional):使用者定義的離散變數格式
- GPROC:指定要繪製的圖形。有以下幾種選擇:
- BCHART - 直立長方圖
- SPLOTR - 散佈圖+迴歸線
- SPLOT – 散佈圖
- LPLOT – 線圖
- KMPLOT – KM圖。注意,要畫這個圖則 XRANGE 和 BYVARA 這兩個 macro 變數一定要有。
- REFL (Optional):指定X軸或Y軸的參考線(reference)。
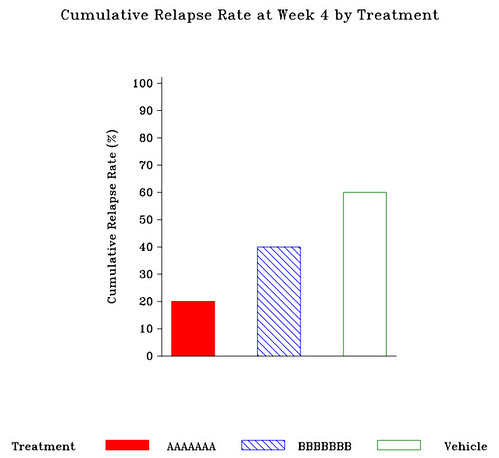
例一:直立長方圖(一)
程式:
**user-defined format;
proc format;
value rantrt
1=’AAAAAAA’
      2=’BBBBBBB’
      3=’Vehicle’;
run;
**call the gengph macro for the bar chart;
%gengph(inds=all1,
    xvara=treat,
    xlabel=%str(Treatment),
    xrange=,
    xfmt=rantrt,
    yvara=percent,
    ylabel=%bquote(Cumulative Relapse Rate (%)),
    yrange=%str(0 to 100 by 10),
    yfmt=,
    byvara=,
    bylabel=,
    byfmt=,
    gproc=bchart,
    refl=);
在第一個例子裡面,首先先去設定使用者定義的變數格式,這一段需要額外使用 PROC FORMAT 程序。本例是設定 X 軸三個 Treatment 名稱,因為原始變數是用 1, 2, 3,所以利用 PROC FORMAT 給予這三個數值有意義的名稱。接著使用該作者所寫的 %gengph 巨集來畫圖。inds 代入名為 all1 的資料集。X 變數是 treat,其 label 是 Treatment,格式則把剛剛在 PROC FORMAT 設定好的 rantrt 放進去。Y 變數是 percent,其 label 是 Cumulative Relapse Rate (%),而範圍則是從 0 到 100,並每 10 格為一單位。最後在 gproc 中放上 bchart 就大功告成了。成品如下:
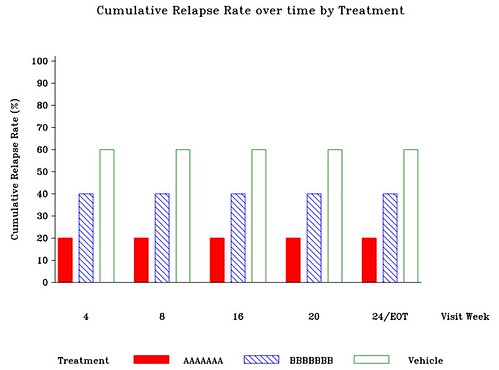
例二:直立長方圖
程式:
**user-defined format;
proc format;
value rantrt
1=’AAAAAAA’
      2=’BBBBBBB’
      3=’Vehicle’;

Value wk
4=’4’
      8=’8’
     16=’16’
     20=’20’
     24=’24/EOT’;
run;


**call the gengph macro for the bar chart;
%gengph(inds=all1,
    xvara=treat,
    xlabel=%str(Treatment),
    xrange=,
    xfmt=rantrt,
    yvara=percent,
    ylabel=%bquote(Cumulative Relapse Rate (%)),
    yrange=%str(0 to 100 by 10),
    yfmt=,
    byvara=week,
    bylabel=%str(Visit Week),
    byfmt=wk,
    gproc=bchart,
    refl=);
這個例子是上個例子的加強版,主要的差別是再把每個 treatment 按 week 分成三類。所以多了一個 PROC FORMAT 程序來設定 week 變數的格式(wk)。然後把 week 安置在 byvara 這個參數裡面,其 label 是 Visit Week,放在 bylabel 這邊,然後把格式名稱 wk 放在 byfmt 就完成了。成品如下:
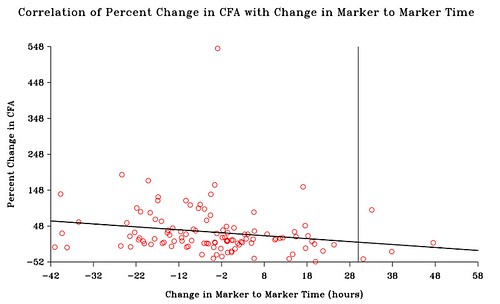
例三:散佈圖加迴歸線
程式:
**call the gengph macro for the scatter plot with regression line;
%gengph(inds=splot,
    xvara=x,
    xlabel=%str(Change in Marker to Marker Time (hours)),
    xrange=,
    xfmt=,
    yvara=pctc_cfa,
    ylabel=%str(Percent Change in CFA),
    yrange=,
    yfmt=,
    byvara=,
    bylabel=,
    byfmt=,
    gproc=splotr,
    refl=%str(href=30));
這種圖對於要做迴歸報告的學生來說相當方便。首先把資料 splot 帶入,X 變數即 x,其 label 是 Change in Marker to Marker Time (hours)。Y 變數是 pctc_cfa,其 label 是 Percent Change in CFA。gproc 就設定 splotr。如果要在 x=30 的地方畫一條垂直的 reference line,就在 refl 設定 href=30。如果不要可以不管這個設定。成品如下:
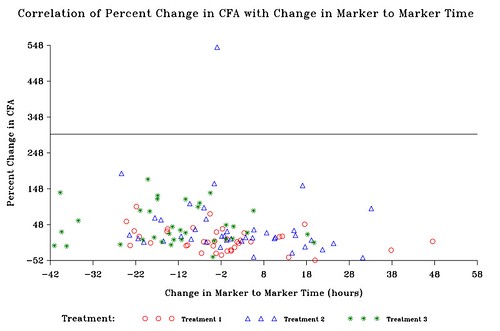
例四:一般散佈圖
程式:
**user-defined format;
proc format;
value trtf
1=’Treatment 1’
      2=’Treatment 2’
      3=’Treatment 3’;
run;


**call the gengph macro for the scatter plot;
%gengph (inds=splot,
    xvara=x,
    xlabel=%str(Change in Marker to Marker Time (hours)),
    xrange=,
    xfmt=,
    yvara=pctc_cfa,
    ylabel=%str(Percent Change in CFA),
    yrange=,
    yfmt=,
    byvara=trt,
    bylabel=%str(Treatment: ),
    byfmt=trtf,
    gproc=splot,
    refl=%str(vref=300));
這個例子是例三的簡化版本,因為沒有包含回歸線。不過 Tsang 安置了三個不同的 trt 在裡面,每種 trt 有自己的 symbol 和顏色。所以基本上參數的設定和例三很像,不過是多了 trt 的設定。首先用 PROC FORMAT 把 trt 的格式 trtf 弄好,然後把 trt 放在 byvara,trtf 放在 byfmt,最後把 Treatment 放在 bylabel 處。記得要在 gproc 那邊把 splotr 改成 splot,不然迴歸線照樣跑出來。本例則是另外設定了一條水平的 reference line 於 y=300 處。成品如下:
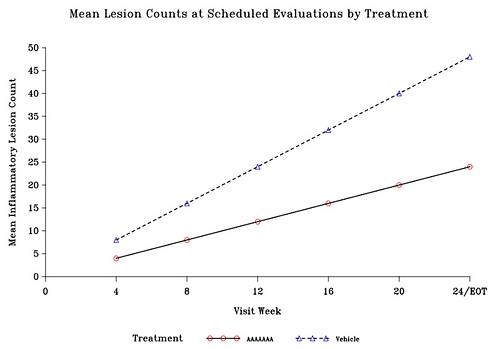
例五:線圖
程式:
**user-defined format;
proc format;
value rantrt
1=’AAAAAAA’
      2=’Vehicle’;

Value wk
0=’0’
4=’4’
      8=’8’
     16=’16’
     20=’20’
     24=’24/EOT’;
run;


**call the gengph macro for the line plot;

%gengph(inds=stat,
    xvara=week,
    xlabel=%str(Visit Week),
    xrange=%str(0 to 24 by 4),
    xfmt=wk,
    yvara=mean,
    ylabel=%str(Mean Inflammatory Lesion Count),
    yrange=,
    yfmt=,
    byvara=treatn,
    bylabel=%str(Treatment),
    byfmt=rantrt,
    gproc=lplot,
    refl=);
這個線圖是把每個 treatment 在每個時間點上取平均值,然後各畫一條線來表示他們的時間趨勢。所有的設定都和前面幾個例子一樣,先用 PROC FORMAT 把 week 和 treatn 的格式(wk, rantrt) 弄好。然後一一把 X, Y 以及 by statement 的變數名稱、Label、格式等一一插入,最後在 gproc 處宣告 lplot 即可。成品如下:
例六:KM圖
程式:
**user-defined format;
proc format;
value trtf
1=’Treatment 1’
      2=’Treatment 2’;
run;


%gengph(inds=main,
xvara=t_death,
    xlabel=%nrstr(Time (Days)),
    xrange=%str(0 to 110 by 10),
    xfmt=,
    yvara=death,
    ylabel=%str(Survival Distribution Function),
    yrange=%str(0 to 1 by 0.1)
    yfmt=,
    byvara=rantrt__,
    bylabel=%str(Treatment Group),
    byfmt=trtf,
    gproc=kmplot,
    refl=);
這個例子是典型用在倖存分析上的 Kaplan-Meier 圖。但 macro 的參數設定方式和前幾例差距不大。重點只是記得要把 kmplot 放在 gproc 即可。成品如下:

原文之後只要在講解 %gengph 是怎樣寫出來的,不過一般使用者不太需要去瞭解程式內部建構的原理,只要懂得怎麼去用即可。所以僅列出原始的 macro 程式:
%macro gengph(inds=,
    xvara=,
    xlabel=,
    xrange=,
    xfmt=,
    yvara=,
    ylabel=,
    yrange=,
    yfmt=,
    byvara=,
    bylabel=,
    byfmt=,
    gproc=,
    refl=);

 **For a scatter plot;
 %let inter=none;

 **For a line plot;
  %if "%upcase(&gproc)" = "LPLOT" %then %do;
   %let inter=join;
  %end;

  **For a scatter plot with regression line;
  %if "%upcase(&gproc)" = "SPLOTR" %then %do;
   %let inter=rl;
  %end;

  **For a Kaplan-Meier time to event plot;
  %if "%upcase(&gproc)" = "KMPLOT" %then %do;
   %let inter=steplj;
  %end;

    symbol1 value=circle  h=0.17 in cv=red  ci=black width=4 i=&inter l=1;
    symbol2 value=triangle  h=0.17 in cv=blue  ci=black width=4 i=&inter l=2;
    symbol3 value=:  h=0.17 in cv=green ci=black   width=4 i=&inter l=3;
    symbol4 value=square  h=0.17 in cv=black ci=black   width=4 i=&inter l=4;
    symbol5 value=dot h=0.17 in cv=black ci=black  width=4 i=&inter l=5;

 **Defining the Y-axis;
 %if "&yrange" = "" %then %do;
  axis1 minor=none  order=(&miny to &maxy by &byvaly) offset=(0 pct)
  label=(angle=90 font=triplex h=0.175 in "&ylabel") length=4 in;
 %end;
 %else %do;
  axis1 minor=none  order=(&yrange) offset=(0 pct)
  label=(angle=90 font=triplex h=0.175 in "&ylabel") length =4 in ;
 %end;

 **Defining the X-axis;
 %if "&xrange" = "" %then %do;
  axis2 minor=none order=(&minx to &maxx by &byvalx)
  offset=(0 pct)  label=(font=triplex h=0.175 in "&xlabel") ;
 %end;
 %else %do;
  axis2 minor=none order=(&xrange)
  offset=(0 pct)  label=(font=triplex h=0.175 in "&xlabel") ;
 %end;
 %if "&bylabel" ne "" %then %do;
legend1 label=(f=triplex h=0.175 in "&bylabel" j=l) value=(f=triplex  h=0.12 in
j=l);
 %end;

%if "%upcase(&gproc)" = "SPLOT" or "%upcase(&gproc)" = "LPLOT" %then %do;
proc gplot data=&inds;

 **Add user-defined formats;
  %if "%upcase(&xfmt)" ne "" %then %do ;
   format &xvara &xfmt..;
  %end;
  %if "%upcase(&yfmt)" ne "" %then %do ;
   format &yvara &yfmt..;
  %end;

  **The following code will be executed when no classification variable
  is specified;
  %if "%upcase(&byvara)" = ""  %then %do;
   plot &yvara*&xvara/noframe vaxis=axis1 haxis=axis2 &refl nolegend;
  %end;

  **The following code will be executed when a classification variable
   is specified;
  %else %do;
    plot &yvara*&xvara=&byvara/noframe vaxis=axis1 haxis=axis2
   &refl legend=legend1;
  %end;
run;
quit;
%end;

%if "%upcase(&gproc)" = "SPLOTR" %then %do;
 proc gplot data=&inds;
  %if "%upcase(&xfmt)" ne "" %then %do ;
   format &xvara &xfmt..;
  %end;
  %if "%upcase(&yfmt)" ne "" %then %do ;
   format &yvara &yfmt..;
  %end;
  %if "%upcase(&byvara)" = "" %then %do;
   plot &yvara*&xvara/noframe regeqn vaxis=axis1 haxis=axis2
   &refl nolegend;
  %end;
  %else %do;
   plot &yvara*&xvara=&byvara/noframe regeqn vaxis=axis1 haxis=axis2
   &refl legend=legend1;
  %end;
 run;
 quit;
%end;

%if "%upcase(&gproc)" = "KMPLOT" %then %do;

**Generate K-M survivor function using ODS;
proc lifetest data=&inds  method=km ;
time &xvara*&yvara(0);
strata &byvara;
ods output productlimitestimates=lifeout;
run;


**Get maximum time to event;
data _null_;
call symput("_maxt",scan(scan("&xrange",2,"to"),1,"by"));
run;

**Carry forward any missing values in the survivor function;
data lifeout;
set lifeout;
retain surv .;
if survival>. then surv=round(survival,.01);
format &xvara 8. surv 5.1;
run;

proc sort data=lifeout;
 by &byvara &xvara;
run;

**cap maximum time for display;
data lifeout;
set lifeout;
by &byvara &xvara;
if &xvara<&_maxt then output;   if &xvara=&_maxt then do;    if first.&xvara then output;   end;  run;    **Generate the time to event plot;  proc gplot data = lifeout;    %if "%upcase(&xfmt)" ne ""  %then %do;     format &xvara &xfmt..;    %end;    %if "%upcase(&yfmt)" ne ""  %then %do ;     format surv &yfmt..;    %end;    %if "%upcase(&byfmt)" ne ""  %then %do ;     format &byvara &byfmt..;    %end;    plot surv*&xvara=&byvara/haxis = axis2 vaxis = axis1 legend=legend1;  run;  quit; %end;  %if "%upcase(&gproc)" = "BCHART" %then %do;     pattern1 value=s color=red;     pattern2 value=l1 color=blue;     pattern3 value=e color=green;     pattern4 value=x1 color=purple;     pattern5 value=r1 color=orange;          axis3 label=(angle=180 h=0.175 in f=triplex " ") value=none offset=(4 pct);    proc gchart data=&inds;   %if "&byvara" ne "" %then %do;     label &byvara="&bylabel";   %end;     %if "%upcase(&xfmt)" ne "" %then %do ;    format &xvara &xfmt..;   %end;   %if "%upcase(&yfmt)" ne "" %then %do ;    format y &yfmt..;   %end;   %if "%upcase(&byfmt)" ne "" %then %do ;    format &byvara &byfmt..;   %end;      label &xvara="&xlabel";    vbar &xvara / sumvar=y               %if "&byvara" ne "" %then %do;                  group=&byvara                  subgroup=&xvara                   discrete                    width=2                  noframe                  maxis=axis3                  raxis=axis1                  space=1;                %end;                %else %do;                  subgroup=&xvara                   discrete                    width=5                  noframe                  maxis=axis3                  raxis=axis1                  space=5;                %end;   run;   quit; %end;
最後只有一個地方要提醒,那就是這個程式只能容納五種不同的 symbol,所以如果要使用五種以上的 symbol,得需要在程式裡面紅色的部分自行添加。
CONTACT INFORMATION
Your comments and questions are valued and encouraged. Contact the author at:
Rita Tsang
Averion International
225 Trunpike Road
Southborough, MA 01772
Rita.Tsang@averionintl.com
沒有留言:
張貼留言
要問問題的人請在文章下方的intensedebate欄位留言,請勿使用blogger預設的意見表單。今後用blogger意見表單留言的人我就不回應了。